750.00 · 3.5% · 1h 18m
Binance · Bybit · Spot · Futures
Trade the orders.
Not the candles.
Every large resting order on Binance and Bybit — spot and futures — on one map, ranked by how much it deserves your trust. The moment price reaches one, bounces off it, eats through it or breaks it, you get a message.
Free while ObScreener is in open beta. No card, no plan to choose.
4venues on one axis
5alert types
9charts per screen
An illustration of the density map. Sample numbers, not live quotes.
The gap
A screener tells you what already happened.
Every tool you already own describes the past, or one pair at a time. The orders that will decide the next move are sitting in the book right now, unread.
Percent tables are a rear-view mirror
By the time a coin shows +12% on a list, the move you wanted is already priced in. A ranking of today's winners is a ranking of history.
A depth chart shows one pair
The order book is where the intent is. But you can only stare at one of them at a time, and the market runs hundreds at once.
The level finds you too late
You spot the wall afterwards, in the replay, right under the wick. The whole edge was in the twenty minutes before it.
ObScreener is the view nobody else puts in front of you: the resting orders of the whole market, on one vertical, updating while you watch.
How it works
Three moves, one tab
See the wall
Large orders from four venues land on a single axis measured in percent from price. Above the line is resistance, below it is support.
Judge the wall
Score is a quality rating for the wall rather than a measure of its dollar size. Reliable, Stable and Questionable are the three columns it sorts into.
Trade the wall
Open the chart in the same tab, drop a level on it, and let Approach, Bounce, Eat and Breakout come to you — in the feed and in Telegram.
01 — Density map
The whole market on one vertical
Each card carries the venue, the ticker, the dollar size, the price, the distance, the age, the Score and its share of the day's turnover. Because the axis is percent from price, a $300K wall on a small cap and a $28M wall on BTC sit side by side and mean the same thing: the book is thick right here.
- Reliable · Stable · Questionable — three columns by quality. The wall’s Score picks the column; its dollar size does not.
- BI-F · BI-S · BY-F · BY-S — Binance and Bybit, futures and spot, on one map. Hide a venue with one click.
- Score is a quality rating for the wall, so a small cap and BTC stay comparable.

02 — Multi-chart
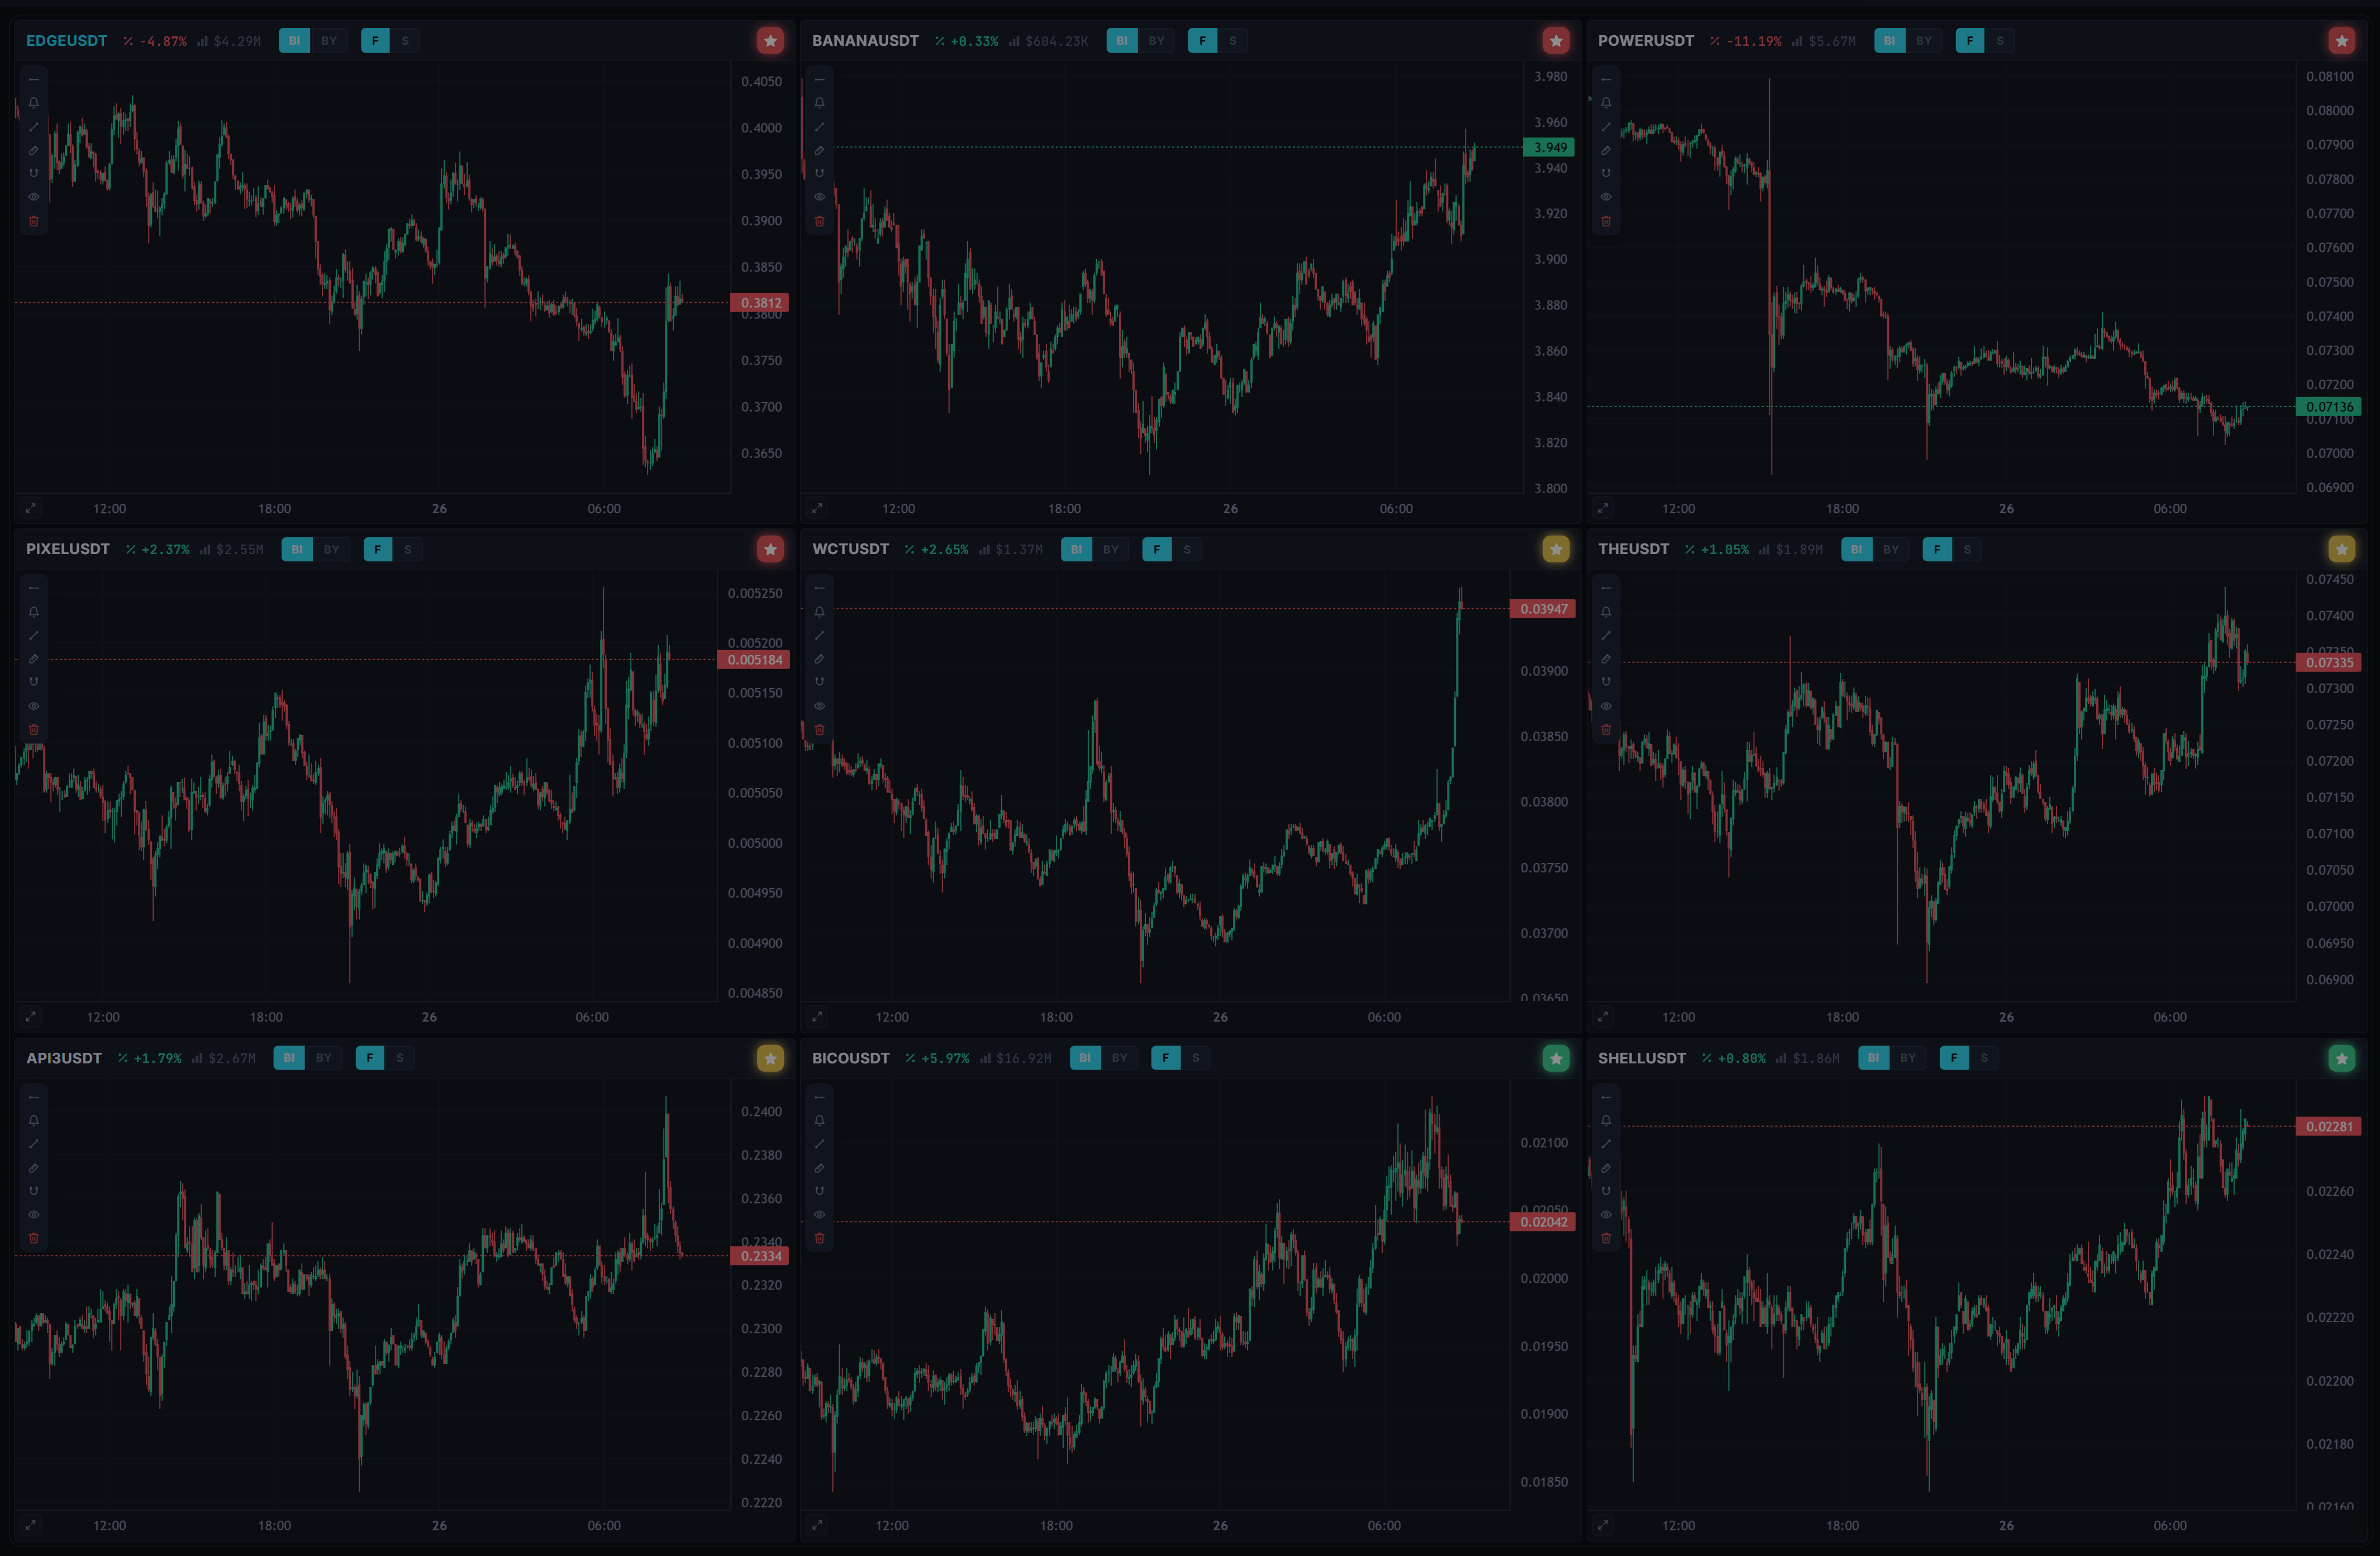
Nine charts. One preset. No tab hunting.
A grid of one to nine panes with saved presets. Every pane carries its pair, the day's change, volume, its venues and whatever metric you pin to it.
- Lines, trend, ruler and alert levels drawn straight on the pane.
- EMA, VWAP, Bollinger, RSI and MACD, remembered per timeframe.
- One coin across five timeframes, or five coins on one — up to 5 presets of 5 pages each.
03 — Watchlist
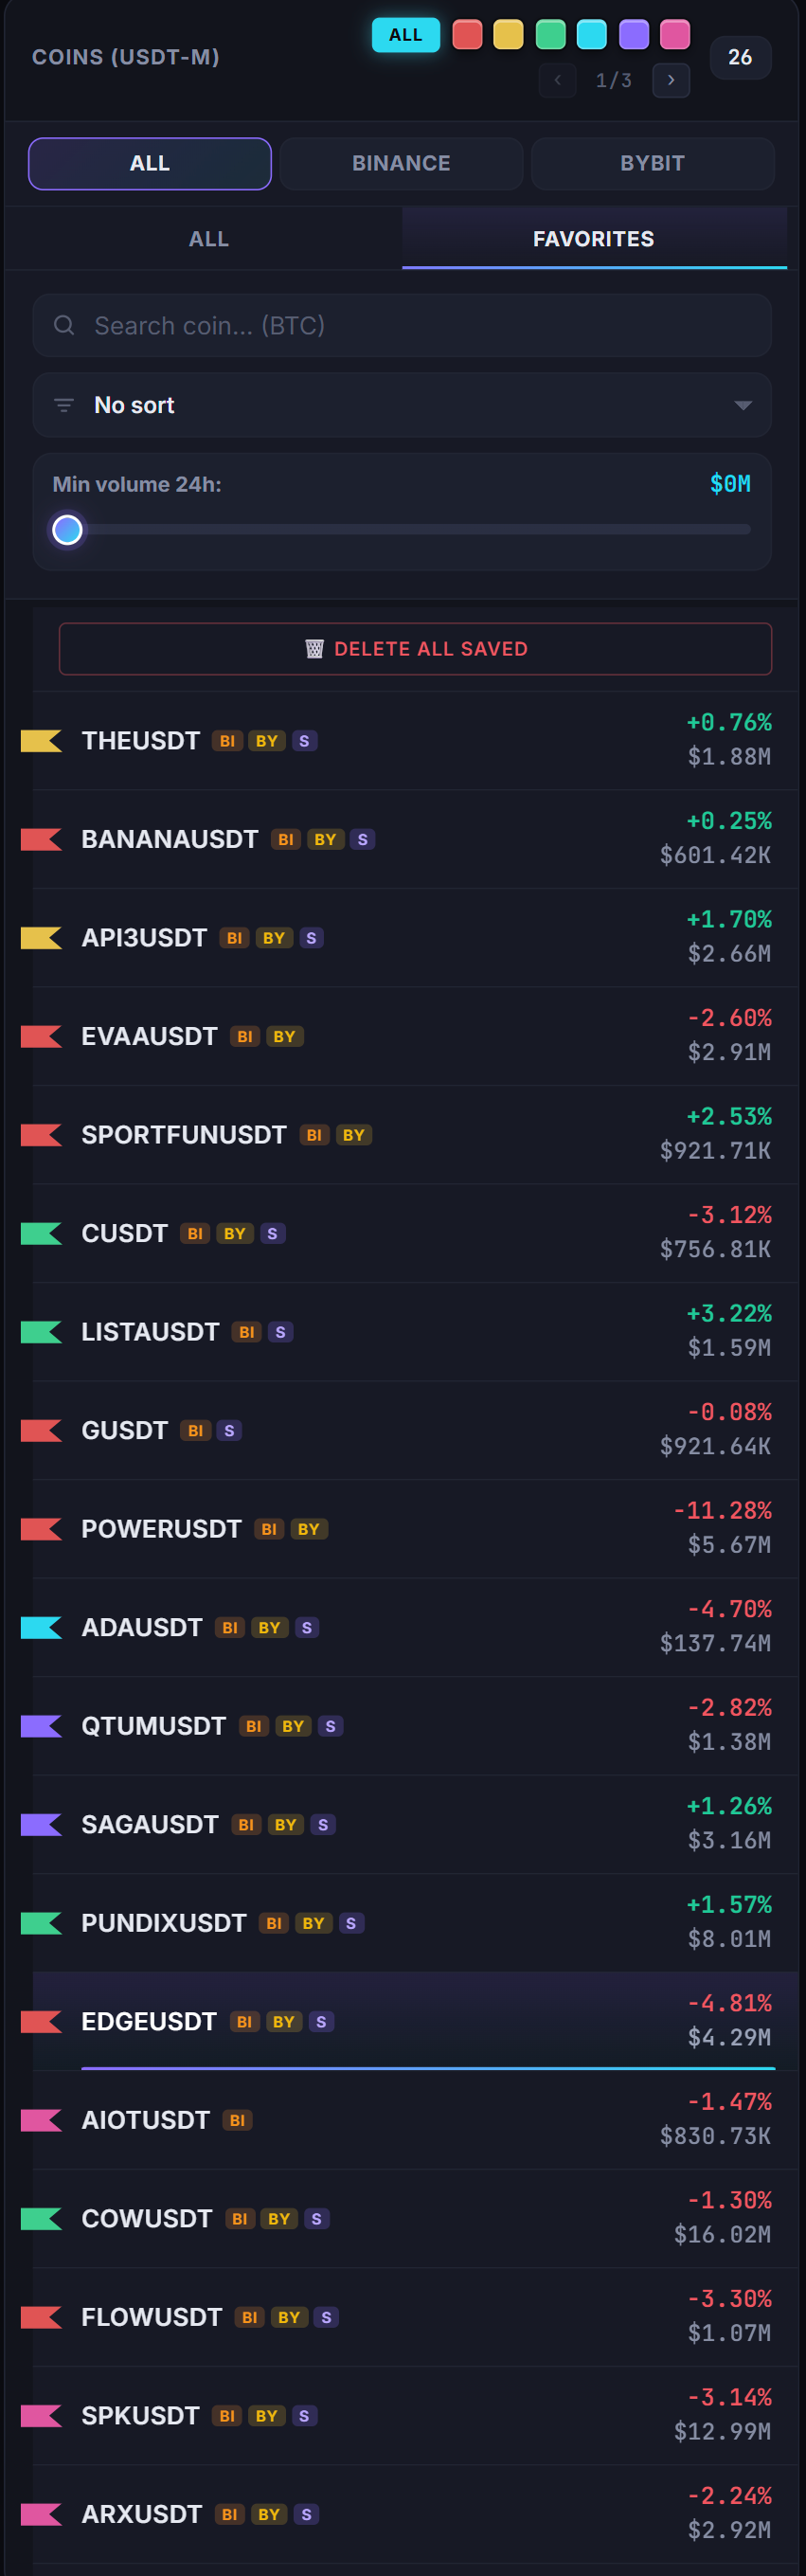
Your groups, not the exchange's
Filter by venue, flag favorites, search by ticker, cut everything under a volume floor. Colour marks the group you invented, not the exchange the coin came from.
- Spot and futures of one coin share a single row.
- BI and BY badges show where the pair actually trades.
- Clear one colour group without touching the rest.
- Add metric columns: RVOL, NATR, BTC correlation, spread and more.
04 — Alerts
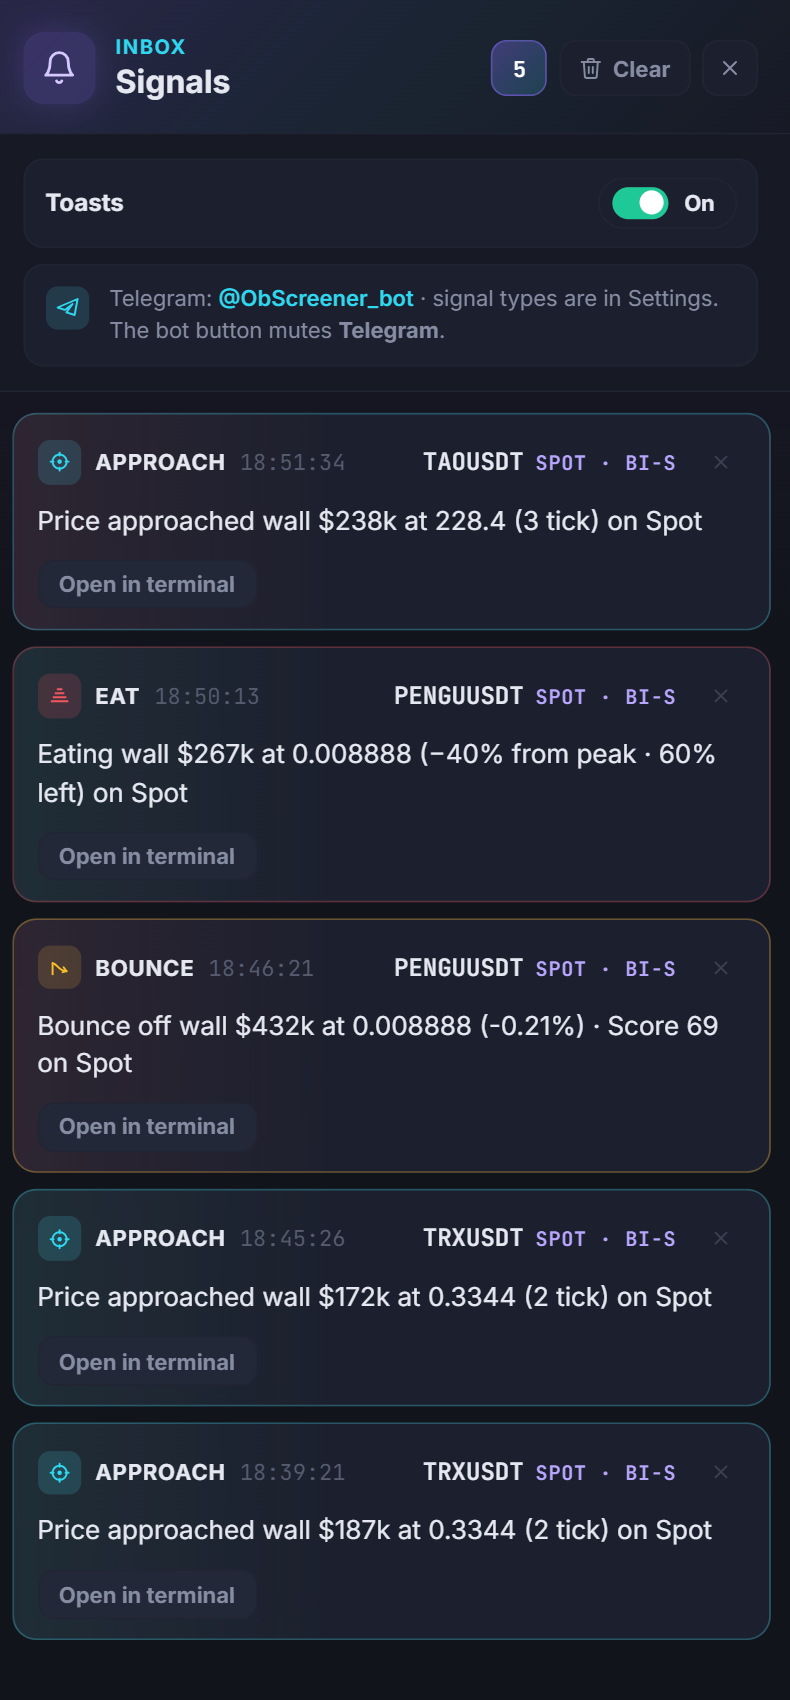
The wall moves. Your phone knows first.
Approach, Bounce, Eat and Breakout arrive in the in-app feed and in Telegram, each with a link that opens the exact chart at the exact level.
- Switch a type off and it reaches neither the site nor the bot.
- Mute Telegram and the terminal separately.
- Toasts pop up on screen while you keep working.
Four things a wall can do
You do not watch the level. It calls you.
A level only matters at four moments. ObScreener waits for all four so that you do not have to.
Approach
Price has arrived at the level. The card names the pair, the venue and the exact price.
Bounce
The impulse failed. The level held and price turned away from it.
Eat
Trades are chewing into the wall — the tell that usually shows up before a break.
Breakout
The wall gave way. One bell, one card, one link back to the chart.
4venues — Binance and Bybit, spot and futures
5alert types — Approach, Bounce, Eat, Breakout, Level
9charts on a single screen
5interface languages
0API keys — public market data only
Documentation
Everything the labels mean
The settings narrow the map down to the way you trade. Here is what each control actually does.
Reading the density map
The axis is the distance from the current price, in percent. The price line sits in the middle: everything above it is resistance, everything below it is support.
A card carries the venue, the ticker and the size, plus price, distance, age, Score and share of the day's turnover. The colour comes from the ticker, so one coin always keeps one shade — it is an identity, not a buy signal.
The three columns sort walls by quality rather than by dollars: each wall lands in the column its Score puts it in. If the map looks empty, lower Min Score in the settings.
Venue codes: BI-F, BY-S
BI is Binance, BY is Bybit. F is USDT-M futures, S is spot. Clicking the same letters on a chart hides that venue's densities.
Active pairs refresh more often than quiet ones. Stablecoin pairs and gold or ETF pairs can be hidden so they stay out of the way.
BI-F Binance · Futures
BI-S Binance · Spot
BY-F Bybit · Futures
BY-S Bybit · Spot
Score, thresholds, working range
The wall threshold follows each coin's 24h volume, so a level is judged against its own liquidity. In the settings you set a floor and a working range inside the allowed bounds.
Score is a quality rating for the wall, from 0 to 100. The higher it runs, the higher the quality of that density, and the column the wall lands in follows it.
Min lifetime is how long a wall has to sit in the book before it counts. After gone is how long its trace stays on the map once it has been pulled.
Alerts and Telegram
Approach, Bounce, Eat, Breakout and Level each have their own switch in the settings. A disabled type reaches neither the site nor the bot.
Mute all of Telegram from the bot chat with /stop. Turning a type off in the settings mutes it in the feed and in the bot at the same time.
The star on a chart marks a watchlist favorite. It is not a Score.
Charts, presets, watchlist
Up to 5 presets with 5 pages each, and layouts from one to nine windows. Indicators are remembered per timeframe.
The watchlist keeps colour groups, favorites, a venue filter and a minimum volume. Search understands plain tickers such as BTC, and spot and futures of one coin share a row.
Extra metrics can be pinned to charts and to the watchlist: RVOL, NATR, volume spike, BTC correlation, trade count, spread and more.
Account, trial, languages
Signing up needs no email: a login of 3 to 24 characters (latin letters, digits, underscore) and a password of 8 or more. Telegram gets linked once from the account dialog, and while the beta runs that is all access takes.
Password reset goes through that same Telegram, so the account stays recoverable without an inbox.
The terminal speaks English by default, with Українська, Deutsch, Türkçe and Español a click away.
Glossary
- Wall
- A resting limit order large enough to stand out from the rest of that coin's book.
- Score
- A quality rating for the density, from 0 to 100. The higher the number, the higher the quality of that wall.
- Reliable / Stable / Questionable
- The three columns of the map. Each wall sits in the column that matches its quality.
- Vol %
- The wall's size as a share of that coin's 24h turnover.
- RVOL
- Current volume measured against the coin's own recent average.
- NATR
- Average true range as a percentage, so ranges stay comparable across coins.
Straight answers
The questions you were about to ask
Do I have to connect an exchange account?
No. ObScreener reads public market data only. No API keys, no trading permissions, no withdrawal rights — there is nothing to connect and nothing to lose.
Is this a signal service that tells me what to buy?
No. It reports what the order book is doing: a level exists, price reached it, it held or it broke. What you do with that is your trade and your risk.
Does it replace TradingView?
It answers a different question. A charting tool shows you price history; ObScreener shows the resting orders around it. Most people keep both open.
Which markets are covered?
USDT pairs on Binance and Bybit, both spot and futures. The wall threshold scales with each coin's 24h volume, so a small cap is measured against itself and not against BTC.
Do I have to keep the site open?
No. Alerts are sent from the server, so Telegram reaches you with the tab closed and the laptop shut. The in-app feed is waiting when you come back.
Can I sign up without an email?
Yes — a login and a password is the whole form. Telegram is only needed for the free trial and for resetting a password.
What does it cost right now?
Nothing. ObScreener is in open beta and the whole terminal is free. Paid plans arrive once the beta ends.
Is there anything to cancel?
No. Nothing is charged and no subscription runs in the background.
Access
Right now it costs nothing.
ObScreener is in open beta. The whole terminal is open while it lasts: no card, no plan to choose, nothing to cancel.
Open beta
Free
Every venue, every alert type, every chart.
- The full terminal, nothing held back
- Binance and Bybit, spot and futures
- Density map, alerts, charts, watchlist
- No card and no email at sign-up
The terminal
Everything above lives behind one button
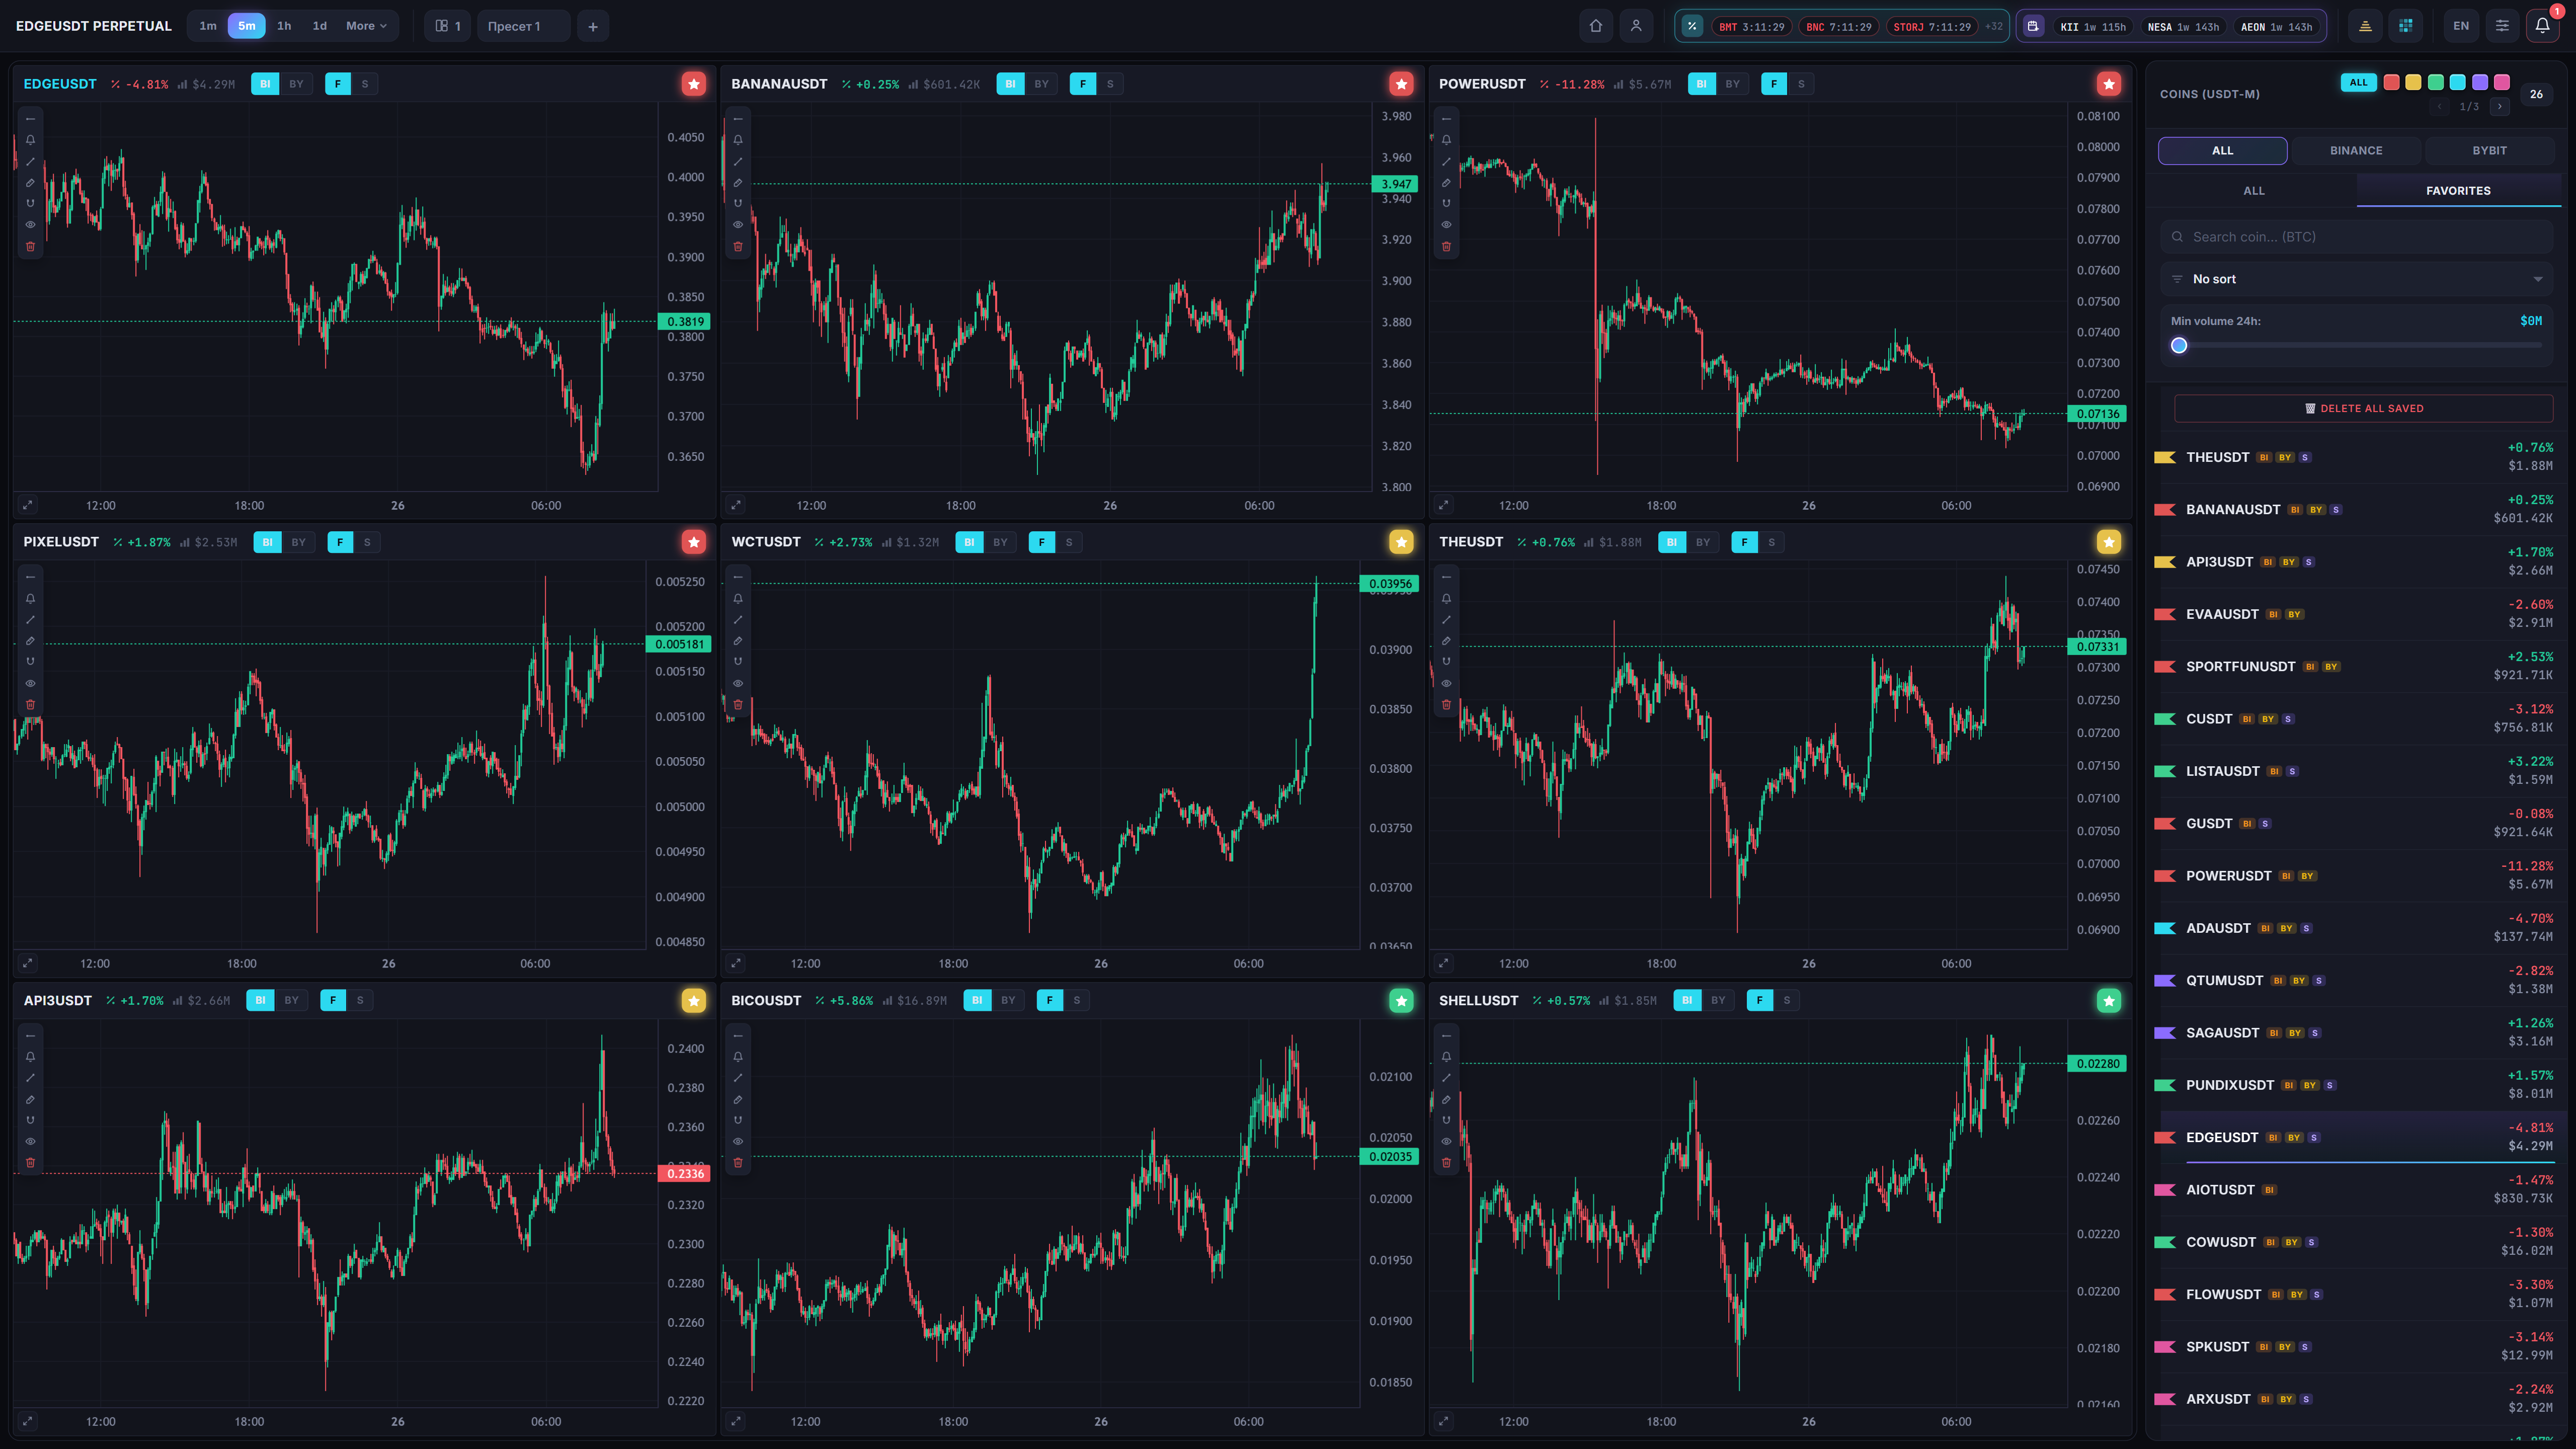
This page explains the product. The map, the order books, the charts and the alerts open inside, the moment your account is set up.
Support
Questions, or something not working? Write to us.
Telegram and email both reach us. Pick whichever you already have open.
Access, outages, billing.
The same topics, in a chat. The signal bot is a separate one.
Usually on the same business day.
The orders are already
on the book.
Three days is more than enough to find out whether you can read them.
Free during the open beta. No card, nothing to cancel.